Bitcoin And Crypto Market Cap Remain In Downtrend – BCH, BNB, EOS, TRX Analysis
-
The total crypto market cap is trading well below the $192.0B and $200.0B resistance levels.
-
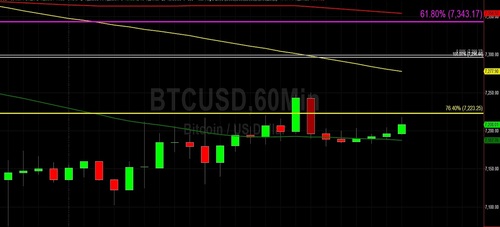
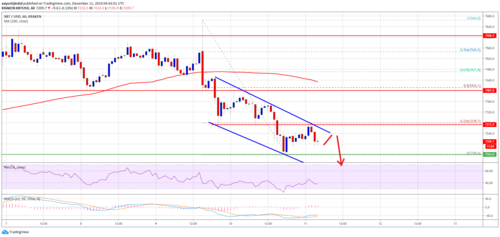
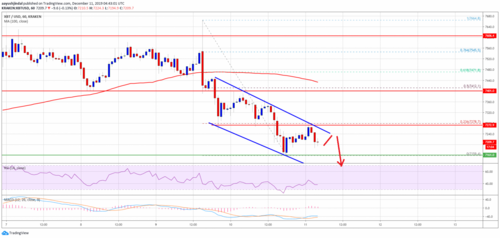
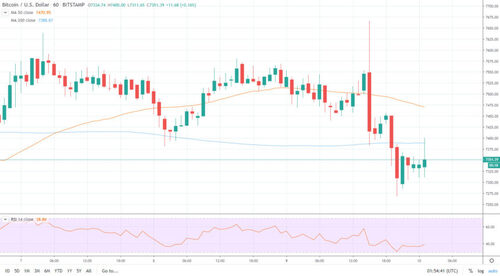
Bitcoin price is struggling to stay above the main $7,000 support area.
-
EOS price is declining and it is likely to trade below the $2.500 support area.
-
Binance Coin (BNB) is approaching the key $14.00 support area.
-
BCH price is still holding the main $205 and $200 support levels.
-
Tron (TRX) price is now trading below the $0.0140 support area, with a bearish angle.
The crypto market cap and bitcoin (BTC) are showing a lot of bearish signs. Ethereum (ETH), binance coin (BNB), ripple, BCH, tron (TRX), litecoin and EOS are trading near key supports.
Bitcoin Cash Price Analysis
After a short term upward correction, bitcoin cash price failed to climb above the $225 resistance area against the US Dollar. The BCH/USD pair is currently declining and it is trading near the $205 support area.
On the downside, the main support is near the $200 level. If there is a downside break below the $200 handle, there is a risk of more losses in the near term. The next key support is near the $185 level.s
Binance Coin (BNB), EOS, Tron (TRX) Price Analysis
EOS price failed to surpass the $2.700 resistance area and recently started a fresh decline. The price is now trading below the $2.600 level and it is approaching the $2.500 support area. If there is a downside break below the $2.500 level, there is a risk of more losses towards $2.350.
Tron price is showing a lot of bearish signs and it recently settled below the $0.0140 level. TRX price is about to continue lower towards the $0.0135 support area, where buyers are likely to appear. On the upside, there are many hurdles near $0.0140 and $0.0142.
Binance coin (BNB) followed a bearish path below the $15.00 resistance area. BNB price even settled below the $14.50 level and it could continue to decline towards the $14.00 support area. Any further losses below $14.00 might put the bulls under a lot of pressure in the near term.
.png)
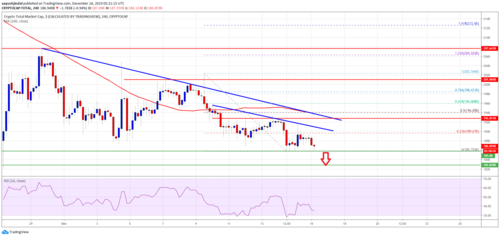
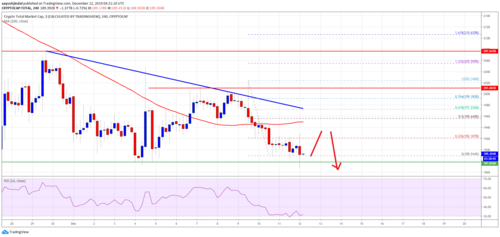
Crypto Market Cap
Looking at the total cryptocurrency market cap 4-hours chart, there was a steady decline below the $195.0B level. The crypto market cap even broke the $192.0B support and it is now below the $190.0 level. If there is a downside break below $185.0B and $182.0B, the market cap could continue to slide.
Therefore, there are chances of more downsides in bitcoin, Ethereum, TRX, LTC, EOS, ripple, ADA, XLM, WTC, BCH, and ICX in the near term.
Aayush Jindal
David – http://markethive.com/david-ogden
.png)
.png)


.png)
.png)