Bitcoin Cash ABC Litecoin and Ripple Daily Analysis 301119

Bitcoin Cash – ABC, Litecoin and Ripple Daily Analysis – 30/11/19

It’s a mixed start to the day, with Bitcoin Cash ABC bucking the trend. Failure to move through to key levels could see the majors hit reverse, however.

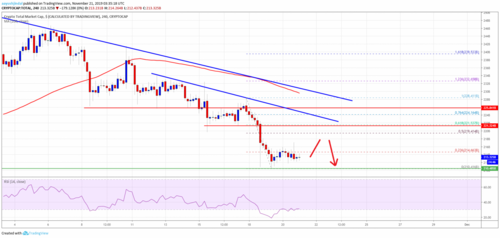
Bitcoin Cash – ABC – Bucks the Trend Early

Bitcoin Cash ABC rose by 1.49% on Friday. Partially reversing a 2.28% decline from Thursday, Bitcoin Cash ABC ended the day at $223.43.

A bullish start to the day saw Bitcoin Cash ABC rise from an early morning intraday low $220.16 to a mid-morning high $225.60.

Steering clear of the major support levels, Bitcoin Cash ABC broke through the first major resistance level at $220.79.

Coming up against the second major resistance level at $225.17, Bitcoin Cash ABC fell back to $221 levels before an afternoon recovery.

In the recovery, Bitcoin Cash ABC rallied to a mid-afternoon intraday high $226.44.

Bitcoin Cash ABC broke back through the second major resistance level at$225.17 before easing back to $223 levels.

At the time of writing, Bitcoin Cash ABC was up by 0.34% to $224.19. Bitcoin Cash ABC rose from an end of Sunday $223.43 to an early morning high $224.19.

The major support and resistance levels were left untested early on.

For the day ahead, Bitcoin Cash ABC would need to steer clear of sub-$224 levels to support a run at the first major resistance level at $226.53.

Bitcoin Cash ABC would need the support of the broader market, however, to break back through to $225 levels.

Barring a broad-based crypto rally, Friday’s high $226.44 and first major resistance level would likely limit any upside.

Failure to steer clear of sub-$224 levels could see Bitcoin Cash ABC see red for a 2nd time this week.

A fall through to $223.30 levels would bring the first major support level at $220.25 into play.

Barring a crypto meltdown, however, Bitcoin Cash ABC should steer clear of sub-$220 levels on the day.

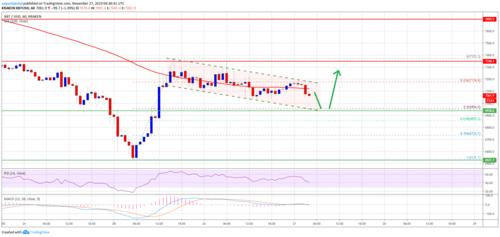
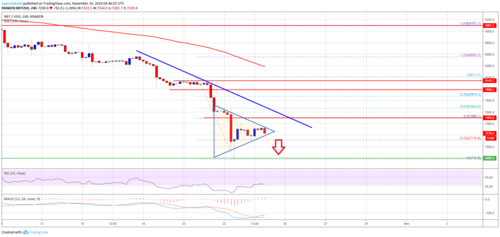
Litecoin Struggles at $48

Litecoin rallied by 3.88% on Friday. Reversing a 1.86% fall from Thursday, Litecoin ended the day at $48.68.

A bullish start to the day saw Litecoin rally from an early morning intraday low $46.84 to an early afternoon intraday high $49.36.

Steering clear of the major support levels, Litecoin broke through the first major resistance level at $47.93 and second major resistance level at $48.96.

Through the late afternoon, Litecoin slipped back to $48 levels before an early evening return to $49.3 levels.

Resistance at $49 weighed, however, with Litecoin sliding back through the second major resistance level at $48.96.

At the time of writing, Litecoin was down by 0.82% to $48.28. A mixed start to the day saw Litecoin rise to an early morning high $48.83 before falling to a low $47.93.

Litecoin left the major support and resistance levels untested early on.

For the day ahead, a move through to $49 levels would bring the first major resistance level at $49.75 into play.

Litecoin would need the support of the broader market, however, to break out from Friday’s high $49.36.

Barring a broad-based crypto rally on the day, resistance at $49 would likely limit any upside on the day.

In the event of a market rebound, Litecoin could visit $50 levels for the 1st time since 22nd November…

Failure to move through to $49 levels could see Litecoin slide deeper into the red.

A fall through the morning low $47.93 would bring the first major support level at $47.23 into play.

Barring an extended sell-off, however, Litecoin should steer clear of sub-$47 support levels on the day.

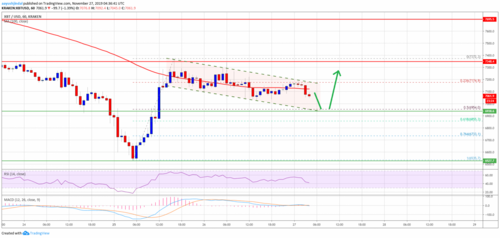
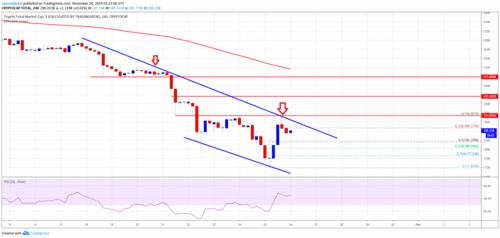
Ripple’s XRP Holds onto $23

Ripple’s XRP rallied by 3.23% on Friday. Reversing a 0.43% fall from Thursday, Ripple’s XRP ended the day at $0.23150.

A bullish start to the day saw Ripple’s XRP rally from an early intraday low $0.22365 to a mid-afternoon intraday high $0.23400.

Steering clear of the major support levels, Ripple’s XRP broke through the first major resistance level at $0.2286. Coming up against the second major resistance level at $0.2332, Ripple’s XRP fell back to sub-$0.23 levels in the late afternoon.

Late in the day, Ripple’s XRP found support to close out the day at $0.23 levels.

At the time of writing, Ripple’s XRP was down by 0.54% to $0.23026. A bullish start to the day saw Ripple’s XRP rise to an early morning high $0.23349 before sliding to a low $0.23022.

Ripple’s XRP left the major support and resistance levels untested early on

For the day ahead, a hold onto $0.23 levels would support a run at the first major resistance level at $0.2358.

Ripple’s XRP would need the support of the broader market, however, to break out from the morning high $0.23349.

Barring a broad-based crypto rally, Friday’s high $0.2340 and first major resistance level at $0.2358 would likely limit any upside.

Failure to hold onto $0.23 levels would bring the first major support level at $0.2254 into play before any recovery.

Barring an extended sell-off, however, Ripple’s XRP should steer clear of the second major support level at $0.2194.


Bob Mason

Nov 30, 2019 05:14 AM GMT


David – http://markethive.com/david-ogden

Bitcoin Prices Rebounded so What’s Next?

Bitcoin Prices Rebounded, so What’s Next?

Cautiousstill in the air as market prepares for the year-end

Overview

The prices of bitcoin initially stabilized near the 7500 levels after dipping into the 6500 area earlier this week. As we wrap up November, where will bitcoin prices go from here? While altcoins also have shown signs of recovery, what does that mean to the “Alt Season” believers?

Bitcoin: Short Term Cautiously Optimistic; Medium TermStill Cloudy

The prices of bitcoin have initially recovered from the November low of 6513, but the short-term and medium-term outlooks of the leading cryptocurrency could be two different pictures. On the short term front, preliminary data shows that market sentiment has turned slightly positive alongside the prices rebound. The Crypto Fear & Greed Index has jumped from 17 to 32 on September 28, suggesting market participants have eased certain of their worries as the price stabilized, although the reading is still considered at a “Fear” level.

Figure 1: Crypto Dear & Greed Index (Source: Alternative.me)

Technical-wise, we’ve also seen preliminary recovery signals, but the rebound could soon be tested again, and the coming days could be key to determine if that’s a true reversal or just a short-lived rally.

Figure 2a shows BTCUSDT has initially formed an uptrend on a 3-hour chart (red channel), the rebound hit the upper end of the channel, which is also near the major resistance line since late October (yellow line).

While both the ultimate oscillator and RSI have produced some higher highs, suggesting upside momentum has been building up. From here, two scenarios could happen. 1) The 3-hour chart could first find the bottom support of the latest uptrend before retest the October resistance, given that the pair must produce a higher low. 2) The pair consolidate at current levels until the momentum fades, if seen, the breaking of the lower end of the uptrend could be the first warning sign of further corrections. If we are going to begin to see a 3-hour upturn as is our bias, it would further support the likelihood of the first scenario.

Figure 2a: BTCUSDT 3-Hour Chart (Source: OKEx; Tradingview)

Figure 2b: BTCUSDT Daily Chart (Source: OKEx; Tradingview)

However, things would be less optimistic if we see it from the daily chart perspective. Figure 2b shows an initial daily reversal of BTCUSDT and the rebound has sent the price back above the June resistance levels (red line). We’ve seen the October rally have sent the price above the resistance levels; however, the pair has failed to turn it into support as the rally ran out of steam.

While the reversal, for now, is still too early to call a real trend reversal, we would like to see those momentum indicators to produce some higher highs, and so far, that has not happened. If the rally momentum fails to sustain, a retest of the blue support line could not be ruled out.

Figure 3: Sentix Bitcoin Strategic Bias (Source: Sentix)

From a longer-term perspective, data from Sentix suggests that some investors still believe that bitcoin remains overvalued. The Sentix Bitcoin Strategic Bias, which measures investors’ six-month perception value of bitcoin. It reflects the strategic view of market participants as well as their underlying convictions and perceptions of value for the cryptocurrency market. The Bias has been moving in a down channel since August. The negative perception could hinder investors to get into the market at this point, especially for long-term HODLers.

Alt-Season: Long Way to Go

While major altcoins have already off their recent lows, we are still very far away from a true start of an “Alt-Season”.

The broader altcoins have made its third attempt to breakout from the market cap downward channel in early November, at the same time, it tried to break above the 365-day moving average (orange line). As the rally momentum fades, altcoin has retreated into the channel in late November.

Figure 4: Crypto Total Market Cap Ex-BTC in Log Scale (Source: Tradingview)

The lower end of the channel (blue line) seems like decent support at this point. However, as the overall conservative sentiment lingers, in our view, we believe that more consolidation is needed for the altcoin market cap before the next breakout attempt happens. This chart could be a quick way to measure the broader altcoin market perceptions.


Cyrus Ip

David – http://markethive.com/david-ogden

Bitcoin going berserk in November makes holidays awkward

Bitcoin going berserk in November makes holidays awkward

Since 2011 the cryptocurrency’s biggest monthly change up or down has occurred in the month before Christmas.

This month, Bitcoin saw longest streak of down days on record. Image: Bloomberg NewsThis month, Bitcoin saw longest streak of down days on record. Image: Bloomberg News

For better or worse, the month of November has always been one to remember in the world of Bitcoin.

Reasons cited for its volatile moves during the 11th month of the year run the gamut from tax-loss harvesting, to its round-the-clock trading nature, to Mercury being in retrograde. It could also just be coincidence. Whatever the cause, Bitcoin tends to go berserk in November.

Take this month, when the world’s largest cryptocurrency fell for 10 consecutive days through Tuesday of this week, notching its longest streak of down days on record. Even with Wednesday’s 6% rebound, the retreat pushed its price down about 17% and put it on pace for its worst month since November of last year. That was when Bitcoin posted it second-worst run in its history — a streak of nine down days that saw it lose 38% of its value through the end of the month, according to data compiled by Bloomberg.

November has also been substantially more volatile for Bitcoin compared with other months, according to Bespoke Investment Group. Since 2011, its biggest monthly change up or down has occurred in November, with the average move coming in about 20 percentage points higher than the next largest.

“It just moves in ways that are not cyclical like other businesses and other markets,” Bobby Cho, a partner at CMS Holdings, said in a phone interview. “Toward the end of the year, other asset classes may start to quiet down just because it’s the holidays and things like that. But in crypto, because of the global nature and it never closing effectively, things are always happening.”

For years now, Bitcoin’s explosive November moves have made it a hot topic at Thanksgiving dinners around the country. This time in 2017, for instance, Bitcoin evangelists had a lot to be thankful for, with investors and speculators alike hopping on the crypto gravy train while it soared at an unprecedented rate. Through Thanksgiving day that year, Bitcoin had already posted a monstrous 760% gain for the year.

Fast forward to last year and those even remotely tied to the industry had a lot more explaining to do. The day before Thanksgiving, Bitcoin was trading around $4 400, having dropped about 69% for the year.

“Price and emotions tend to work together so when prices are at all-time highs, everyone is euphoric and probably way over their skis with regard to how fast this industry is going to grow,” Jeff Dorman, chief investment officer at Los Angeles-based investment firm Arca, said by phone. “And when things are in contraction, prices are down, everyone is depressed and acting like the world is ending.”

And this year? Despite its recent drop, Bitcoin’s still up about 95% in 2019, though it’s far off its all-time high of near $20,000 reached in December 2017. A swirl of negative headlines pushed crypto prices lower this month, chief among them China’s sudden and swift crackdown on the trading of digital assets.

Still, the decline has left many undaunted. If anything, they say, it’s a sign cryptocurrencies are maturing — the price swings are similar to those in other asset classes. After all, the argument goes, it’s still a relatively nascent market.

For Nigel Green of deVere Group, the fluctuations are no different than volatility that’s prevalent elsewhere.

“There are peaks and troughs in all financial markets; the cryptocurrency market is not — and should not be — any different,” said the firm’s chief executive officer. “Each time there is a dip in the market or a bout of volatility in cryptocurrencies, the crypto haters declare that digital currencies are finished — only for them to subsequently experience a rally. The same people do not make such extreme and unfounded statements with most other financial markets.”


Vildana Hajric, Bloomberg / 28 November 2019 06:36

David – http://markethive.com/david-ogden

Bitcoin BTC Hesitates But Further Recovery Above 72K Seem Likely

Bitcoin (BTC) Hesitates But Further Recovery Above $7.2K Seem Likely

  • Bitcoin is currentl trimming gains after struggling to clear the $7,400 barrier against the US Dollar.

  • The price is likely to stay above the $7,000 and $6,950 support levels in the near term.

  • There is likely a bullish flag forming with resistance near $7,170 on the hourly chart of the BTC/USD pair (data feed from Kraken).

  • There are chances of a nice upward move if the price surges above $7,200 and $7,400.

Bitcoin price is trading below a few key resistance such as $7,400 against the US Dollar. Having said that, BTC seems to be forming a bullish continuation pattern as long as $6,950 holds.
 

Bitcoin Price Analysis

Yesterday, there was a decent start of an upside correction from the $6,535 low against the US Dollar. BTC climbed nicely above the $6,800 and $7,000 resistance levels.

Besides, it spiked above the $7,200 resistance area and the 100 hourly simple moving average. However, the price struggled to continue above the $7,375 and $7,400 resistance levels.

A high was formed near $7,372 and the price is currently trimming gains. Bitcoin traded below the $7,200 level and the 100 hourly simple moving average. Moreover, there was a break below the 23.6% Fib retracement level of the recent rise from the $6,535 low to $7,372 high.

On the downside, there are a few key supports near the $7,025, $7,000 and $6,950 levels. The main support for the current wave is near $6,950 since it is near the 50% Fib retracement level of the recent rise from the $6,535 low to $7,372 high.

If there is downside break and close below $6,950, the price is likely to resume its decline. The next supports are near the $6,660 and $6,540 levels. On the upside, an initial resistance is near the $7,150 level and the 100 hourly SMA.

More importantly, there is likely a bullish flag forming with resistance near $7,170 on the hourly chart of the BTC/USD pair. Therefore, an upside break above $7,200 might set the pace for more upsides and recovery.

The main resistance area is near the $7,375 and $7,400 levels. A successful close and follow through above $7,400 will most likely set the pace for a strong recovery.

Bitcoin Price

Looking at the chart, bitcoin price is holding a couple of important supports near $6,950. As long as there is no close below $6,950, there are chances of upside continuation above $7,200 and $7,400.

Technical indicators:

Hourly MACD – The MACD is slowly moving back into the bearish zone.

Hourly RSI (Relative Strength Index) – The RSI for BTC/USD is currently below the 50 level.

Major Support Levels – $7,000 followed by $6,950.

Major Resistance Levels – $7,200, $7,375 and $7,400.


Aayush Jindal

David – http://markethive.com/david-ogden

Bitcoin And Crypto Market Recovery Facing Floor Test – BCH Litecoin EOS XLM Analysis

Bitcoin And Crypto Market Recovery Facing Floor Test – BCH, Litecoin, EOS, XLM Analysis

  • The total crypto market cap started an upside correction after tagging $171.8B.

  • Bitcoin price is up close to 10% and it is now trading above the $7,000 resistance.

  • Litecoin (LTC) price is gaining momentum and it could test the $48.50 resistance area.

  • Bitcoin cash price is climbing higher towards the main $220 and $225 resistance levels.

  • EOS price rallied 10% and it even broke the $2.500 resistance area.

  • Stellar (XLM) price is slowly rising towards the $0.0600 resistance area.

Bitcoin (BTC) and the crypto market cap closing towards key resistances. Ethereum (ETH), LTC, ripple, bitcoin cash, EOS, TRX, and stellar are showing short-term positive signs.

Bitcoin Cash Price Analysis

Recently, there was a sharp decline in bitcoin cash price below the $220 and $200 support levels against the US Dollar. BCH price even tagged the $185 support area and it is currently correcting higher. There was nice recovery above the $200 resistance level.

The price is now trading above $210, but there is a strong resistance waiting on the upside near the $220 and $225 levels. On the downside, the $200 level might provide support.

Litecoin (LTC), EOS and Stellar (XLM) Price Analysis

Litecoin price declined heavily after it broke the $50.00 support area. LTC price even traded below the $45.00 level and tested the $42.00 level. It is currently correcting higher and trading above $45.00. It seems like the price is aiming the main $48.50 and $50.00 resistance levels, where the bulls are likely to struggle.

EOS price tested the $2.320 support area and recently started a sharp recovery. The price is up more than 10% and it broke the $2.500 resistance area. An initial resistance is near $2.650, above which there are chances of a run towards the $3.000 resistance area.

Stellar price found support near the $0.0530 level and it is currently correcting higher. XLM price is trading above the $0.0570 level and it could soon test the $0.0585 resistance. The main hurdle for a nice rally is near the $0.0600 and $0.0605 resistance levels.

Crypto Market Cap

Looking at the total cryptocurrency market cap 4-hours chart, there is a strong decline below the $200.0B support area. The crypto market cap tested the $172.0B area and recently started an upside correction. It climbed more than $15.0B and tested the $195.0B resistance area.

However, there are many resistances near the $195.0B and $200.0B levels. Therefore, only a close above the $200.0B floor resistance could trigger more upsides in bitcoin, Ethereum, EOS, litecoin, ripple, XLM, BCH, ADA, BNB, TRX, ICX, and other altcoins in the near term.


Aayush Jindal

David – http://markethive.com/david-ogden

Bitcoin falls to six-month low trades below 7000

Bitcoin falls to six-month low, trades below $7,000

Bitcoin sank nearly 10 percent to the lowest level in six months, extending last week’s slide past the weekend on concerns about a crackdown on cryptocurrency operations by China.

The digital currency plunged as much as 9.8 percent from Friday’s close and was trading just above $6,700 as of 11 a.m. in Hong Kong, according to Bloomberg composite pricing. It’s the first time since May that Bitcoin traded below the key $7,000 psychological level.

The world’s largest cryptocurrency is also on track for eight straight days of declines, tying a record losing streak from 2014, according to Bitstamp pricing going back to August 2011 and including weekend trading.

“Investors can find more joy in traditional markets without the aggressive volatility and opaque markets,” said Jeffrey Halley, senior market strategist for Asia Pacific at Oanda Asia Pacific Pte. “A sustained rally in Bitcoin would require a complete breakdown in the trade negotiations to happen as financial authorities across the world continue to circle the wagons against digital currencies.”

On Friday, the People’s Bank of China told businesses involved with cryptocurrencies to correct any improper actions and asked investors to be wary of virtual currencies. Earlier this month, watchdogs in Shanghai issued notices calling for a cleanup of companies involved in crypto trading, while one in Beijing warned against illegal exchange operations.

There are plenty of other possible explanations for the drop. Traders are blaming low volumes and citing attractive returns from traditional assets, eToro UK market analyst Adam Vettese wrote in a note Friday. Smaller miners are also getting squeezed out by the falling price, causing further selling toward the break-even level of around $5,600 to $6,400, Vijay Ayyar, Singapore-based head of business development at crypto exchange Luno, said Monday.

“We’re seeing what is called miner capitulation and that has indicated previous large drops in the price of Bitcoin,” he said. “At this time, the cost of production could be indicated to be in the $6,000 range and hence we’ve seen the price dip to that range last week.”

Bitcoin is still up substantially in 2019 — it ended last year at $3,674. After a meteoric rise from April to June, when it soared above $13,000, it lost momentum and has been gradually dropping since.


Joanna Ossinger and Eric Lam

Bloomberg

Singapore / Mon, November 25, 2019 / 11:28 am

David – http://markethive.com/david-ogden

Bitcoin Weekly Forecast -BTC Aiming Key 65K Support

Bitcoin Weekly Forecast –  BTC Aiming Key $6.5K Support

  • There was a sharp decline in bitcoin below the $8,000 and $7,500 supports against the US Dollar.

  • The price is currently correcting losses, but remains at a risk below $7,400.

  • There is another breakdown pattern forming with support near $7,240 on the 4-hours chart of the BTC/USD pair (data feed from Kraken).

The price is currently trading below the $7,500 resistance and likely to decline further.

Bitcoin price is trading in a strong downtrend below $7,500 against the US Dollar. BTC is likely to continue lower towards the main $6,500 bearish target.

Bitcoin Price Weekly Analysis (BTC)

This past week, bitcoin started a nasty decline below the $8,000 support area against the US Dollar. As a result, BTC price gained bearish momentum below the $7,800 support and the 100 simple moving average (4-hours).

It opened the doors for more losses and the price even declined sharply below the $7,500 support. Moreover, the price tested the $7,000 support area (the first bearish target as per the medium term outlook).

Finally, the price spiked below $6,900 and a new multi-month low was formed near the $6,776 level. At the outset, bitcoin price is correcting higher and recently traded above the 23.6% Fib retracement level of the last decline from the $8,213 high to $6,776 low.

However, the upward correction is facing resistance near the $7,400 level. Additionally, there is another breakdown pattern forming with support near $7,240 on the 4-hours chart of the BTC/USD pair.

If there is a downside break below $7,240 and $7,200, there are chances of more downsides in the near term. In the mentioned case, the price is likely to break the $7,000 support and $6,800 level. The main target for the bears seem to be the $6,500 support area.

On the upside, the price must break the triangle resistance and $7,400. Besides, the 50% Fib retracement level of the last decline from the $8,213 high to $6,776 low is near the $7,500 level.

The key resistance is near the $7,550 level and a connecting bearish trend line on the same chart. A clear break above the $7,500 and $7,550 resistance levels could set the pace for more gains.

Bitcoin Price

Looking at the chart, bitcoin price is likely setting up for another breakdown below the $7,200 and $7,000 support levels. Conversely, a close above $7,550 is needed for a correction towards the $8,000 level in the coming days.

Technical indicators

4 hours MACD – The MACD for BTC/USD is slowly moving in the bullish zone.

4 hours RSI (Relative Strength Index) – The RSI for BTC/USD is now recovering, but it is well below the 40 level.

Major Support Level – $7,000

Major Resistance Level – $7,550


Aayush Jindal

David – http://markethive.com/david-ogden

Bitcoin Dives to a Six-Month Low on China Crackdown

Bitcoin Dives to a Six-Month Low on China Crackdown

Bitcoin has slumped by nearly a third since late-October.

Bitcoin Dives to a Six-Month Low on China Crackdown

Chinese President last month said the country's economy should accelerate blockchain development

HIGHLIGHTS

Bitcoin fell nine percent to $6,929

Its the lowest since May

Bitcoin in late October slumped by nearly a third

Bitcoin slumped to a six-month low on Friday after China's central bank launched a fresh crackdown on cryptocurrencies, warning of the risks entailed in issuing or trading them. Bitcoin, the world's biggest cryptocurrency, fell nine percent to $6,929 (roughly Rs. 4,97,400), its lowest since May, and was last down seven percent at $7,107 (roughly Rs. 5,10,200). The People's Bank of China's Shanghai headquarters said it would tackle growing cases of illegality involving virtual currencies. It also cautioned investors not to confuse crypto with blockchain technology, the digital ledger that underpins many cryptocurrencies such as bitcoin.

The move came a day after regulators in Shenzhen launched a similar campaign, and came as the PBOC prepares to launch its own digital currency.

Chinese President Xi Jinping said last month that the world's second-biggest economy should accelerate the development of blockchain technology.

Bitcoin, known for its wild price swings, soared over 40 percent in two days after Xi's remarks, with investors betting that Beijing's backing of blockchain and plans for a digital renminbi would accelerate the mainstream embrace of cryptocurrencies.

But since late October bitcoin has slumped by nearly a third.

Jamie Farquhar, portfolio manager at London-based crypto firm NKB Group, said the PBOC statement crystallised a growing sense among crypto investors that China's embrace of blockchain would be unlikely to include cryptocurrencies like bitcoin.

"It's the realisation that the positivity over Xi's blockchain announcement was exaggerated," he said. "It may not include bitcoin at this point."


© Thomson Reuters 2019

By Reuters | Updated: 23 November 2019 10:31 IST

David – http://markethive.com/david-ogden

Bitcoin Daily -Binance Denies Reports Of Police Raid Blockchain Expands To Gaming Payments

Bitcoin Daily –  Binance Denies Reports Of Police Raid; Blockchain Expands To Gaming Payments

Paris-based Ultra, which has created its own blockchain, announced that French video game giant Ubisoft will become the first major gaming system to test out payments on its blockchain for gamers.

“Since Ubisoft is already a leader in the games industry, and shows commitment to probe blockchain as a viable technology for games, we are very excited to be announcing our first cooperation of this kind with them,” said Nicolas Gilot, Co-CEO of Ultra, in a statement. “Ubisoft’s rich portfolio of world-renowned brands — including Assassin’s Creed, Just Dance and Far Cry — is a testament to their dedication to creating quality content for all, and their years-long dedication to exploring blockchain technology ensures they have the knowledge and skills to be excellent block producers.”

Elsewhere, there have been reports that police raided Binance‘s office in Shanghai, but the crypto exchange said it doesn’t have any fixed offices in China.

“Any reports of a police raid are false,” said Leah Li, a spokeswoman for Malta-based Binance, in an email, according to Reuters. “We do not have an office in Shanghai.”

In other Binance news, the crypto exchange announced that it has acquired India-based bitcoin exchange WazirX, which will allow customers to buy and sell crypto with Indian rupees on the Binance Fiat Gateway.

“The young demographic in India give[s] an edge to adopt and build on new financial technologies, and I believe this will play a vital role in making India a global blockchain innovation center to also spur cryptocurrency adoption throughout the larger public in the country,” said CEO Changpeng Zhao of Binance in a press release. “The acquisition of WazirX shows our commitment and dedication to the Indian people, and [to] strengthen the blockchain ecosystem in India, as well as another step forward in achieving the freedom of money.”

After Argentina’s central bank banned consumers from purchasing bitcoin and other crypto using credit cards, the country has seen the highest amount of bitcoin trades over the past two weeks. The surge is similar to what was seen in India and China, which saw a boost in crypto trading after the digital currencies were banned in those nations.

“Capital controls seem to have a direct correlation with getting people more interested in bitcoin because it’s something the government can’t control. The population of the country sees these capital controls are put in place, and then they’re going to look for a way around it. That’s where bitcoin and crypto come in, as they give a good way to store and transfer values when they’re dealing with this type of uncertainty,” said the co-founder and chief operations officer at ShapeShift exchange according to Cointelelgraph.


By PYMNTS Posted on November 22, 2019

David – http://markethive.com/david-ogden

Crypto Market Could Dive To 200B Bitcoin Turns Red – BCH XLM EOS TRX Analysis

Crypto Market Could Dive To $200B, Bitcoin Turns Red – BCH, XLM, EOS, TRX Analysis

  • The total crypto market cap is currently in a bearish zone below the $220.0B resistance.

  • Bitcoin price is trading above the $8,000 support and remains at a risk of more losses.

  • BCH price is now consolidating losses below the $250 resistance area.

  • EOS price is declining and approaching the $3.050 and $3.000 support levels.

  • Stellar (XLM) price is down more than 2% and it is now below the $0.0650 support.

  • Tron (TRX) price is down close to 4% and it is trading near the $0.0165 support.

Bitcoin (BTC) and the crypto market cap are currently in a heavy downtrend. Ethereum (ETH), BCH, stellar (XLM), ADA, EOS, ripple, and tron (TRX) are under a lot of selling pressure.

Bitcoin Cash Price Analysis

Recently, BCH price declined heavily below the $265 support area against the US Dollar. The price even broke the $250 support area and traded close to $235. It is currently consolidating losses above $240 and facing a strong resistance near the $250 and $255 levels.

The main resistance is now near the $265 level. On the downside, an initial support is near the $235 level, below which the price could test the $225 level.


Stellar (XLM), EOS and Tron (TRX) Price Analysis

EOS price declined sharply in the past few days and broke many key supports near $3.500 and $3.350. The price is now trading in a bearish zone and it is approaching the $3.050 and $3.000 support levels. A downside break below $3.000 might push the price towards $2.850.

Stellar price trimmed most its gains from well above the $0.0700 level and it is now declining below $0.0168. XLM price even broke the $0.0650 support and it seems like it is likely to test the $0.0620 support area. On the upside, the $0.0665 may perhaps act as a resistance.

Tron price faced an increase in selling pressure after it broke the 0.0185 support area. TRX price is down around 4% and it is trading near the $0.0165 support area. If there are more losses, the price is likely to continue lower towards the $0.0152 support area.

Crypto Market Cap


Looking at the total cryptocurrency market cap 4-hours chart, there are many bearish signs visible below the $220.0B and $230.0B resistance levels. On the downside, the main support is near the $210.0B level, below which there is a risk of a drop towards the $200.0B support area. Therefore, there are chances of more downsides in bitcoin, Ethereum, EOS, ripple, litecoin, bitcoin cash, XLM, TRX, BNB, WAN, WTC, ICX, and other altcoins in the near term unless the crypto market cap climbs back above $230.0B.


Aayush Jindal

David – http://markethive.com/david-ogden