
Mark Yusko – Everyone Should Be Purchasing Bitcoin
When it comes to bitcoin, most analysts seem split right down the middle, with some like Warren Buffett telling us to avoid it all costs, and hedge fund manager Mark Yusko telling us to buy it at all costs.
Yusko: BTC Is an Important Asset
In a recent interview with CNBC, the CEO of Morgan Creek Capital told his listeners to “buy it” when it came to bitcoin and said that we should not be thinking about the recent price drops. He said that while all assets will fluctuate, bitcoin is still in its development stage, and the user base, while it’s growing steadily, is still relatively small.
This, he says, is a major advantage for investors, particularly for new ones, in that they’ll still be one of the early figures to get involved in cryptocurrency, thus heightening their chances to build wealth in the future. He commented that the price of bitcoin “doesn’t matter,” and says that the focus should not be on what’s happening today.
Last summer, when the currency was trading at roughly $12,000, Yusko said he was confident the asset could potentially reach $30,000 before the next major pullback. He’s certain that pullbacks tend to occur regularly; you just need to know how to read them. Granted you don’t sell your stash before it occurs, the best idea could be to sit and wait, as every asset must go up before coming down again.
His advice seems to go against several bitcoin notables including Tom Lee of Fundstrat fame, who just yesterday was quoted as saying that right now is a very bad time to be trading or buying bitcoin. Lee appears more affected by the price than Yusko does and commented that until the S&P goes up, bitcoin has zero chance of breaking out.
This is coming from the man who despite 2018’s numerous bitcoin crashes, predicted repeatedly that the currency would end the year in the $15,000 or $20,000 range. Lee later stated that bitcoin could potentially end 2019 at $40,000 per unit.
Crypto Making a Comeback?
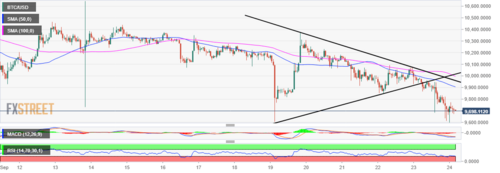
At press time, the currency has recovered somewhat from the recent bloodbath that knocked several digital assets down by anywhere between six and 23 percent. Bitcoin fell by roughly 11 percent within a few short minutes, dropping from the mid-$9,000 range to about $8,100. It later fell below $8,000 and was trading at approximately $7,868 during today’s early morning hours. It has since hopped back up to about $8,030.
Ethereum, on the other hand, has risen by about ten dollars since its recent fall, currently trading at $167 per token. It’s a welcome change from the dismal $157 it was trading at roughly 48 hours ago, and while there’s still plenty of room for improvement, it’s nice to see all the major coins working hard to return to their previous marks.
NICK MARINOFF · SEPTEMBER 27, 2019 · 3:00 PM
David – http://markethive.com/david-ogden


 t
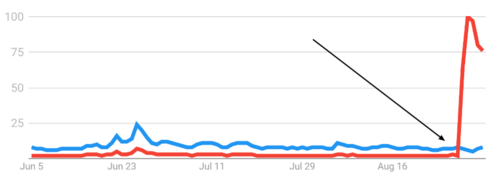
t Searches for "BTC" (red) have never been higher, with Romania a possible the source of the surge. GOOGLE TRENDS


