
Bitcoin price whipsaws on Fed rate decision, reclaims support above $34,600
The broader crypto market experienced a slight uptrend in trading on Wednesday after the Federal Reserve announced that it would be holding interest rates steady in a range of 5.25%-5.5%, the highest level in 22 years.
While rates remain unchanged for the time being, the central bank left the door open for future increases as they work to bring inflation back to their 2% target. Fed Chair Jerome Powell said the committee “is proceeding carefully” and will continue to make decisions “meeting by meeting.”
Stocks climbed higher following the announcement as traders saw the pause as evidence that the risk-on environment has returned. At the close of markets, the S&P, Dow, and Nasdaq finished in the green, up 1.05%, 0.65%, and 1.43%, respectively. Treasury yields sank lower, with the 10-year yield trading around 4.755%
Data provided by TradingView shows that Bitcoin’s (BTC) price whipsawed near midday, spiking to a high of $35,200 before dipping to $34,080. The top crypto has since climbed back above support at $34,600.
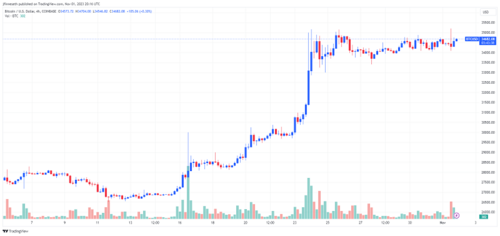
BTC/USD Chart by TradingView
Senior Kitco technical analyst Jim Wyckoff noted that “November Bitcoin futures prices [were] a bit weaker in early U.S. trading Wednesday,” and said, “Recent price action has formed a bullish pennant pattern on the daily bar chart.”
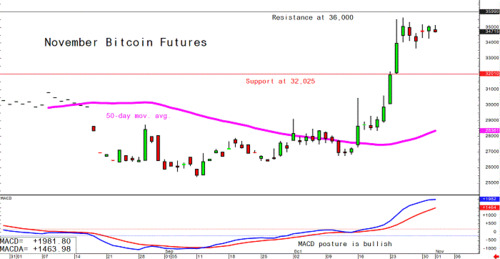
Bitcoin futures 1-day chart. Source: Kitco
“However, prices need to see a bullish upside breakout this week, or the bullish pennant will be negated,” Wyckoff warned. “The BTC bulls still have the solid near-term technical advantage as a price uptrend is in place on the daily bar chart.”
MN Trading analyst Gunter Lackmann said the daily chart for Bitcoin shows its price is “in a bullish consolidation resembling an ascending triangle chart pattern as the 8EMA, a reliable source to look for relative strength, is catching up with price.”
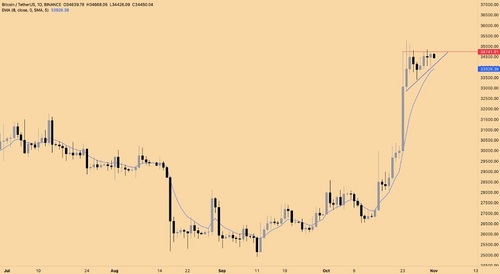
BTC/USD 1-day chart. Source: MN Trading
“Currently, the most obvious invalidation of this pattern would be daily candle closes under $34k, but we should also be ready for an intraday retest of the 8EMA, which last got tagged on October 23,” he said. “Upside resistance is at around $34.8k.”
Zooming in on the 1-hour chart, Lackmann said there is a “clear consolidation pattern, especially focused between $34,240 – 34,760.”
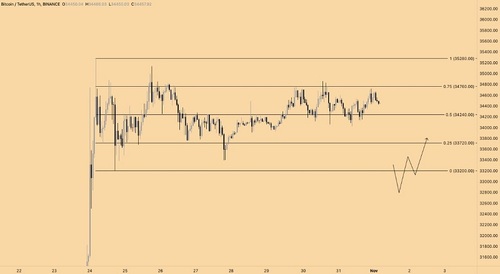
BTC/USD 1-hour chart. Source: MN Trading
He said the “most preferable entry into long exposure here probably would be a raid of the range low ($32.2k) followed by a reclaim of the range.”
“Most conservative traders wait until after the move to the upside (often divided into two – three legs up) completes” to reenter the market, he said. “My targets for those potential legs up from here are the areas of $36 – 38k and $40 – 42k. From there, it will become more likely that we get a retest of the previous HTF range high of around $31.5k, just when the market gets excited for more upside.”
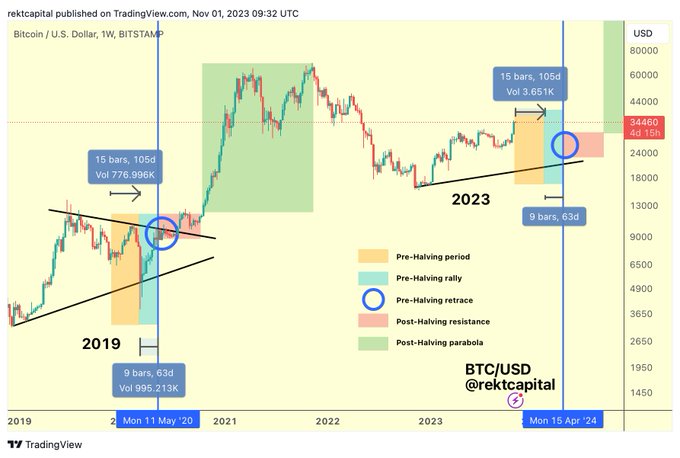
For traders waiting for a significant pullback before opening a position in Bitcoin, market analyst Rekt Captial warned that there are only 100 days left when such an opportunity could present itself.
Altcoins in an uptrend
A majority of tokens in the top 200 recorded gains on Wednesday, while only nine coins saw losses greater than 3%.
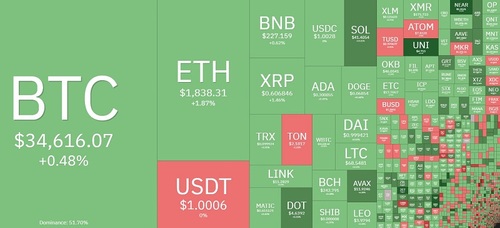
Daily cryptocurrency market performance. Source: Coin360
SushiSwap (SUSHI) was the top performer, with an increase of 46.4%, followed by a gain of 26.8% for Just (JUST), and 16.3% for Uniswap (UNI). Polymesh (POLYX) led the losers with a decline of 11.64%, while MobileCoin (MOB) lost 10.5%, and Centrifuge (CFG) fell by 9%.
The overall cryptocurrency market cap now stands at $1.29 trillion, and Bitcoin’s dominance rate is 52.4%.
By
Jordan Finneseth
For Kitco News
David – http://markethive.com/david-ogden