Corona Virus Next Step UK

Corona Virus Next Step UK

Corona Virus is a hidden deadly menace and will require a change to how we live and work, many people do not take it serious.

I actually find a 2 metre personal space very pleasant and believe this should become the new socialist norm. YES manage changes need to be made to public transport, remove seats and redesign interiors, the same goes for pubs and restaurants.

Supermarkets have the lead the way with in my Opinion Tesco getting it right with directional lanes around the entire supermarket. Yes it may take longer sometimes to shop but you can also get home deliveries which I think will become the norm.

Work from home will be the new norm for many people and will mean companies will quire less office space.

Pavements, walkways and cycle lines need to be widened and redesigned to allow cities and towns to cope with non motorised transport.

Air conditioning systems need to looked at in Planes and Buildings, coaches, trains, Cruise ships and hotels. Fresh rather than canned air is best.

The biggest concern I have is that many people dont seem to care or think about others. The modern generation do not have discipline. The government are going to rely on technology to assist in tracking the virus but It also relies heavily of self reporting and I question how successful this will be.

Many people are concerned out personal rights a.nd possible misuse of data. I am concerned about staying alive and healthy.

Schools and learning require new investment as many do not have enuogh physical classroom spaces for the current school roles.
 

David Ogden

David – http://markethive.com/david-ogden

Don’t be deceived by rallies gold prices and stocks both due for pullback Phil Streible

Don’t be “deceived” by rallies; gold prices and stocks both due for pullback – Phil Streible

Gold prices, in U.S. dollar terms, and stocks are both overbought and traders can expect a correction in the short to medium term, this according to Phil Streible, senior market strategist at Blue Line Futures.

“I just think it’s overvalued at this point. There’s about 311 companies out there that have recently gone into this distressed state. The bankruptcy levels are increasing. I’m quite bearish on U.S. equities,” Streible told Kitco News. “As soon as [the NASDAQ] breaks down a bit, there’s going to be a quick run to the door. I think the S&P 500 should be around 2,500.

Gold prices should be testing the $1,666 an ounce level on the downside and if this floor is broken, the trend could become bearish.

“Gold has really stopped. If you look at that chart pattern, it got over that $1,750 on a closing basis, I thought we were going to run back up into $1,780, we just didn’t do it, we started to slide off. So if you look, it’s got this bearish pattern going on, we’ve got to break that downtrend,” he said. “I really think that gold is not going to be this great asset.”

While in the U.S., stimulus measures have largely been priced into gold since the Federal Reserve has already “thrown everything in,” Streible noted, other countries are about to follow suit and so gold could see price appreciation vis a vis foreign currencies.

“I think gold futures are not going to be as robust as they once were [in U.S. dollar terms], but if you look at gold versus the euro, right now it’s 1,575, the all-time high gold in euros is 1,625. I think that’s your play, gold versus the euro, it will continue to go up,” he said.

The stock markets are really not factoring in the extent of the damage that the economy has suffered due to the pandemic, Streible said.

“It’s very easy to destroy an economy, but it’s very tough to rebuild an economy. Many of these jobs that are lost are not going to come back,” he said, adding that consumer discretionary spending will likely remain weak until December.
 

By Kitco News
For Kitco News

David – http://markethive.com/david-ogden

Gold breaks solidly to the upside with gains of 229 on the day

Gold breaks solidly to the upside with gains of 2.29% on the day

If you recall from my articles from earlier this week, first on Tuesday, May 5 titled “Gold prices firm as U.S. dollar continues to climb”, we included a daily candlestick chart which included a hand-drawn compression triangle, commonly referred to as a pennant formation. We also included an arrow indicating that we were expecting a breakout to the upside. Below is that chart which was available to viewers on Tuesday.

This was followed by another daily candlestick chart yesterday May 6 (see chart Below), in which we had drawn in the compression triangle even though the market had moved to the very bottom of the range, at the support trendline. This chart was sent to our subscribers. Although the market closed on that day right at a critical support line of the compression triangle, we reported that there was no solid break below that trendline, and that it did not constitute any kind of major technical chart damage.

This Western pattern (pennant) is a widely accepted technical tool in which we look for the compression of range, which simply put is created when a market trades sideways with a number of lower highs, and simultaneously higher lows. You can see that on the chart below.

As of yesterday, May 6, the fact that gold had opened at the high of the compression triangle and closed just at the lows made it seem a little less likely that the breakout I was expecting would be to the upside.

My rationale for looking for an upside break was that when technicians view a compression triangle as it releases energy from the apex of that triangle it will typically break above or below support and resistance lines, but most importantly have a significant release of momentum. The energy is accumulated as the range compresses, and is released once a stock or commodity breaks above or below the pattern. Typically, the break out once again move to the most prevalent trend direction, which in the case of gold has definitely been higher.

While it will be tomorrow’s Labor Department’s jobs report that will have a profound and great influence on how the week ends based upon the technical studies, we have presented over the last few days, I believe there is a high probability that we will see a continuation of higher pricing.

Wishing you as always good trading and good health,

By Gary Wagner

Contributing to kitco.com


David – http://markethive.com/david-ogden

Wheaton loads up in silver in Q1

Wheaton loads up in silver in Q1

Wheaton Precious Metals (TSE:WPM) said today attributable gold equivalent production was over 180,000 ounces in the first quarter partially driven by record attributable silver production at Peñasquito.

Silver ounces produced was at 6.7 million ounces, up 18.5% from the same period a year ago.

Revenue was $255 million in the first quarter of 2020 representing a 13% increase from the first quarter of 2019 due primarily to an 18% increase in the average realized gold equivalent price; partially offset by a 4% decrease in the number of gold equivalent ounces sold.

Over $177 million in operating cash flow was generated in the quarter, an increase of over 50%.

Net debt was reduced by $182 million with Wheaton ending the first quarter in a net debt position of $589 million.

The company declared a quarterly dividend of $0.10 per common share.

Wheaton said its outlook is currently withdrawn.

"This pandemic is evolving rapidly and its effects are uncertain," wrote the company.

Last month the company announced a $5 million fund to aid communities affected by COVID-19.


By Kitco News

For Kitco News

David – http://markethive.com/david-ogden

B2Gold touts record revenue cashflow gold production

B2Gold touts record revenue, cashflow, gold production

B2Gold (TSX:BTO) said today it had record quarterly total gold production of 264,862 ounces in Q1.

Revenue was up 44% to $380 million, also a record.

The quarterly consolidated cash flow provided by operating activities from the company's three operating mines was $216 million, also a record. Cash-flow was up $130 million or 151% over the first quarter of 2019.

The jump in gold production over the first quarter of 2019 was driven by the Fekola Mine in Mali, which had a strong start to the year with record quarterly gold production of 164,011 ounces, well-above budget by 9% (14,011 ounces) and 49% (53,662 ounces) higher compared to the first quarter of 2019. Fekola's significant increase in gold production over the first quarter of 2019 was mainly due to expansion of the Fekola mining fleet and optimization of the pit designs and mine plan for 2020, which have provided access to higher grade portions of the Fekola deposit earlier than anticipated in previous mine plans.

Consolidated all-in-sustaining-costs for the first quarter of 2020 were $695 per ounce sold, $110 lower than AISC in the first quarter of 2019. The favourable budget variance resulted from lower-than-budgeted cash operating costs and lower-than-budgeted sustaining capital and exploration expenditures (mainly due to timing and expected to be incurred later in 2020).

At the end of the first quarter of 2020, B2Gold's Calibre announced the temporary suspension of its Nicaraguan operations due to COVID-19. B2Gold has a 34% share of Calibre's production.

The company said it doesn't anticipate any other work stoppages due to COVID-19.

By Michael McCrae
For Kitco News

David – http://markethive.com/david-ogden

Coronavirus pandemic and about 145 billion remains in the congressionally approved fund the US Small Business Administration and Treasury Department said Sunday

Coronavirus pandemic, and about $145 billion remains in the congressionally approved fund, the U.S. Small Business Administration and Treasury Department said Sunday.

The SBA has processed about 2.2 million loans worth more than $175 billion since Congress last month authorized more funding for the Paycheck Protection Program, part of almost $3 trillion in spending to fight the heavy economic toll of the pandemic, which has thrown about 30 million Americans out of work.

The second round of funding was launched on Monday, allowing lenders to issue forgivable, government-guaranteed loans to small businesses shuttered by the outbreak.

The average loan size in the second round of the PPP loan processing has been $79,000, according to the statement released on Sunday.

The U.S. government's $660 billion small business rescue program has stumbled on missing paperwork, technology failure, and the misdirection of funds to big corporations. It also faces the hurdle of forgiving those hastily arranged loans.

The latest data released by the government does not address complaints around the transparency of the program. For example, it not include a breakdown of industries that have received loans.

The pandemic, which has killed more than 66,000 people in the United States, has shuttered wide swaths of American life, closing many businesses and schools and leaving hundreds of millions largely sheltering at home. Over the past week some U.S. states have begun to allow some businesses to reopen.

U.S. processes over $500 billion in small business loans to stem coronavirus fallout

The United States has made over $500 billion in loans to small businesses hit hard by the coronovirus

David – http://markethive.com/david-ogden

Potential short-term bottom identified by a two-day candlestick pattern

Potential short-term bottom identified by a two-day candlestick pattern

While it is a little too early to say that the price correction in gold which began on the 23rd of last month is over, the first signs of a potential bottom have appeared today. Gold pricing did recover this morning, however at the same time, gold traded to the lowest intraday price of $1676 since the intraday low of $1666.50 seen on April 21st.

If this low achieved today holds throughout next week, and gold pricing trades higher we will witness gold trading to a higher low than the previous low. The key will be whether or not gold pricing can move above its most recent high of $1754 achieved on April 23rd.

We have also identified a simple two-day candlestick pattern that can indicate a pivot, or market called a piercing line. This pattern is a two-day candlestick pattern that occurs after the market has been in a defined downtrend. The first day of this pattern begins with a large red candle, which is created when a stock or commodity closes well below its opening price.

The following candle will be composed of a green candle, which is created when a stock or commodity closes well above its opening price. If it also opens below the close of the prior session this creates a price gap between the real body of the previous red candle. The green candle then must close at or above the midpoint of the prior days red candle. Lastly to take the signal one should wait for confirmation which means that the following day is a green candle with a higher high, and higher low than the previous green candle (the bigger the confirming candle the stronger the signal).

Silver traded higher today gaining almost seven cents on the day, with the most active May contract currently fixed at $15.04. The key distinction is that silver is trading below its 21-day exponential moving average and its 50-day moving average. While gold and silver tend to move in tandem, it is quite possible that if we see lower equity prices next week silver will continue to be pressured by its industrial component, rather than act as a safe haven asset.

Gold futures basis the most active contract month (June) closed up by a little over $14 today. As of 4:30 PM EDT gold futures are fixed at $1708.40, which is a net gain of $14.20 on the day. Today’s close is just off the intraday high of $1714.40. Gold never traded below its 50-day moving average. However, yesterday’s decline, as well as today’s opening price were below the 21-day exponential moving average which is currently fixed at $1700.40. Today’s $14 gain put pricing well above that average.

Our technical studies indicate that there is minor resistance at $1710.70, which is the 23% Fibonacci retracement, with the next level of resistance at $1764 which is the high that occurred on the 23rd of last month. With major resistance at $1788, which remains the highest value gold has obtained this year.

Wishing you as always good trading and good health,

By Gary Wagner

David – http://markethive.com/david-ogden

Gold solidly down Thursday following sell off in US equities

Gold solidly down Thursday, following sell off in U.S. equities

Gold prices are posting solid losses in midday U.S. trading Thursday and were near daily lows, following the U.S. stock indexes lower as they also extended daily losses. Bullish outside markets today–a lower U.S. dollar index and sharply higher crude oil prices—offered no support to the precious metals. Some more profit taking in gold and silver from the shorter-term futures traders is featured today. June gold futures were last down $18.00 an ounce at $1,696.50. May Comex silver prices were last down $0.18 at $14.98 an ounce.

Thursday’s weekly jobless claims report, which has become the focal point of the marketplace in recent weeks, showed a rise of 3.84 million in new claims. The number was forecast to be 3.5 million. The report is a reminder of the dour state of the U.S. economy. The U.S. stock market lost its overnight gains after the release of this report.

Global stock markets were mostly firmer in overnight trading. Some upbeat news Wednesday on a drug trial that lessens the effects of Covid-19 and a big rebound in crude oil prices prompted some better trader and investor risk appetite as April winds down. Many U.S. states are now partially reopening their businesses.

In other news, the European Central Bank left its monetary policy unchanged at its regular meeting Thursday. However, the ECB also painted a very bleak picture for the Euro zone economy. The Euro zone gross domestic product contracted by 3.8% in the first quarter from the fourth quarter of 2019, and was down 14.4%, year-on-year, it was reported overnight. Those numbers are a record for the 14-nation bloc. The year-on-year decline in Euro zone GDP was much greater than the 4.8% drop in U.S. GDP in the same period, and reported on Wednesday.

A Reuters (Refinitiv) survey just released shows global jewelry fabrication volumes, which typically account for around 55% of total physical demand for gold, fell 40% in the first quarter, year-on-year. Investment demand was mixed, with retail investment, which consists of bars and coins, posting an 11% year-on-year drop. Physical gold demand fell to 753 metric tons in the first quarter, the lowest levels since 2009 as higher gold prices led to a drop in consumption. The biggest declines were recorded in Asia at down over 43% year-on-year. Chinese demand recorded a 62% decline in jewelry fabrication in the period.

The important outside markets see Nymex crude oil again solidly higher and trading around $17.50 a barrel. The U.S. dollar index is solidly lower today. The greenback bulls are fading fast this week, partly on notions other major countries’ economies are coming back to life faster than that of the U.S. The 10-year U.S. Treasury note yield is trading around 0.6% today.

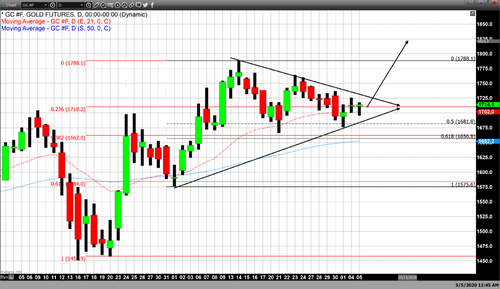
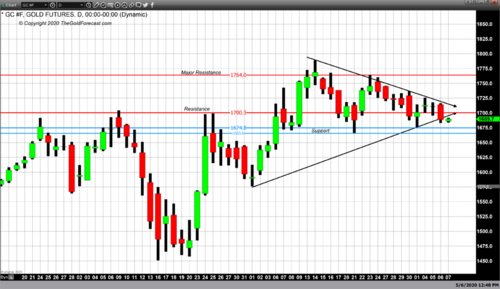
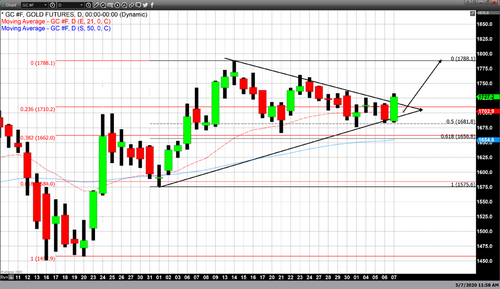
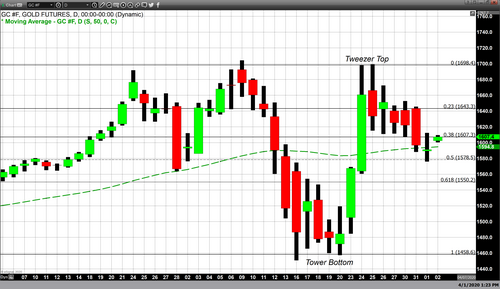
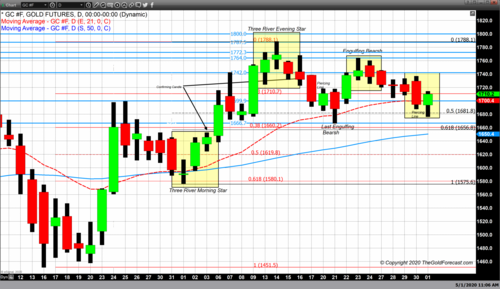
Technically, June gold futures scored a bearish “outside day” down on the daily bar chart today. The bulls still have the firm overall near-term technical advantage amid a six-week-old price uptrend still in place on the daily bar chart. Gold bulls' next upside near-term price objective is to produce a close above solid technical resistance at the April high of $1,788.80. Bears' next near-term downside price objective is pushing prices below solid technical support at last week’s low of $1,666.20. First resistance is seen at $1707.80 and then at $1,725.00. First support is seen at today’s week’s low of $1,687.50 and then at 1,675.00. Wyckoff's Market Rating: 7.0

May silver futures also scored a bearish “outside day” down on the daily bar chart today. The silver bulls have the slight overall near-term technical advantage. However, a four-week-old uptrend on the daily bar chart has stalled out. Silver bulls’ next upside price objective is closing prices above solid technical resistance at the April high of $16.30 an ounce. The next downside price breakout objective for the bears is closing prices below solid support at $14.00. First resistance is seen at $15.25 and then at $15.50. Next support is seen at today’s low of $14.795 and then at $14.56. Wyckoff's Market Rating: 5.5.

May N.Y. copper closed down 285 points at 234.60 cents today. Prices closed near the session low today on profit taking after hitting a six-week high early on. The copper bulls still have the overall near-term technical advantage. Prices are in a five-week-old uptrend on the daily bar chart. Copper bulls' next upside price objective is pushing and closing prices above solid technical resistance at 250.00 cents. The next downside price objective for the bears is closing prices below solid technical support at last week’s low of 214.95 cents. First resistance is seen at today’s high of 240.80 cents and then at 243.00 cents. First support is seen at Wednesday’s low of 233.40 cents and then at 230.00 cents. Wyckoff's Market Rating: 6.0.


By Jim Wyckoff


David – http://markethive.com/david-ogden